
Fig. 5.
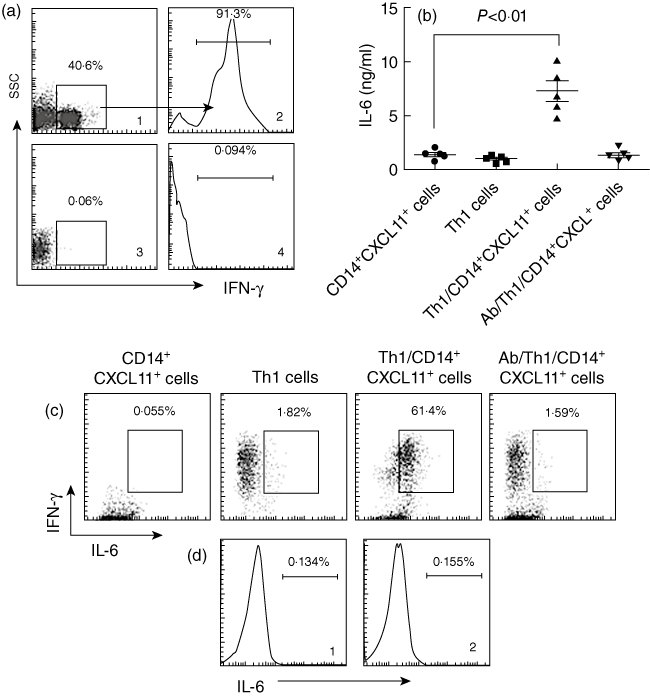
CXCL11 triggers T helper type 1 (Th1) cells to produce interleukin (IL)-6. (a) DO11·10 spleen mononuclear cells were isolated from the spleen and cultured in the presence of ovalbumin (OVA) (323–339; 20 ng/ml), interferon (IFN)-γ (50 pg/ml) and anti-IL-4 (20 pg/ml) for 96 h. The cells were collected and stained with anti-CD4 and anti-IFN-γ antibodies and analysed by flow cytometry. (a1) Representative dot-plot shows the frequency of CD4+ T cells (the gated cells). (a2) Histogram indicates the frequency of IFN-γ+ T cells (the gated area) in the gated CD4+ T cells in (a1). Cells in (a3) were from DO11·10 mice, but not stimulated by IFN-γ/IL-4/OVA; (a4) is an isotype control. (b) CD14+ CXCL11+ cells were prepared as described in the text; CD4+ CD25+ T cells were isolated by magnetic affinity cell sorter (MACS) from the cells in (a). The two cell populations were co-cultured at a ratio of 1:10 (CD14+ CXCL11+ cells : T cells) for 72 h. The scatter dot-plots indicate the levels of interleukin (IL)-6 in supernatant that were measured by enzyme-linked immunosorbent assay. (c) Cells in (b) were collected and stained with anti-IFN-γ and IL-6 antibodies and analysed by flow cytometry. The representative dot-plots indicate the IFN-γ+ IL-6+ cell population (the gated cells). (d) CD14+ CXCL11+ cells were prepared as described in the text and stained with isotype IgG (d1, used as a negative control) or anti-IL-6 antibody (d2). The histograms show the levels of IL-6.