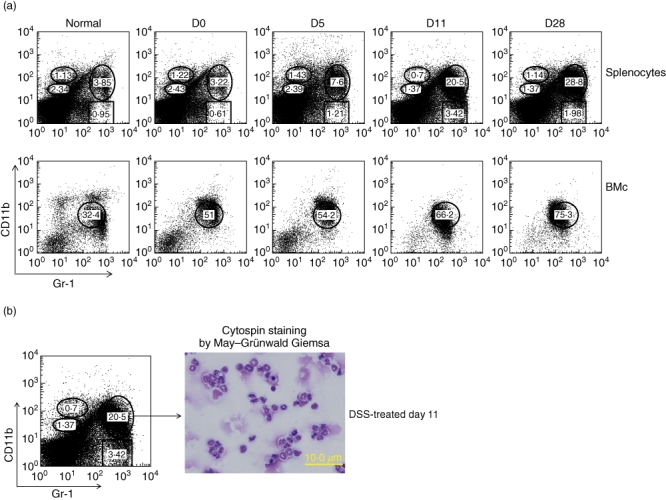
Fig. 2.

Gr1+CD11b+ cells were markedly increased after dextran sulphate sodium (DSS) treatment. (a) Splenocytes (upper) and bone marrow cells (lower) were isolated from normal and DSS-induced C57BL/6 mice. Cells were stained with fluorescein isothiocyanate (FITC)-labelled anti-Gr1 and phycoerythrin (PE)-labelled anti-CD11b and analysed by fluorescence activated cell sorter (FACS), as described in Materials and methods. Each value represents the mean ± standard deviation (s.d.) (n = 4 mice). **P < 0·01 (day 0 mice versus days 5, 7, 12 or 23 mice). (b) Splenic Gr1+CD11b+ cells were isolated on day 11 of DSS by cell sorting. They were cytospun and stained with May–Grünwald Giemsa. Data are representative of five independent experiments.
