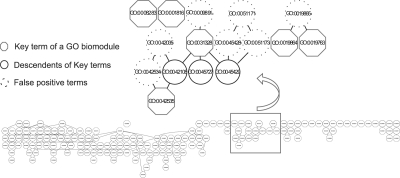
Fig. 1.
Visualization of GO-Module output from the online portal. The key terms are seen as octagons, descendants of identified key terms as circles and false positive terms as dash lined circles. The contiguous hierarchical terms are linked together by lines. GO list from Heinig et al., 2010.

