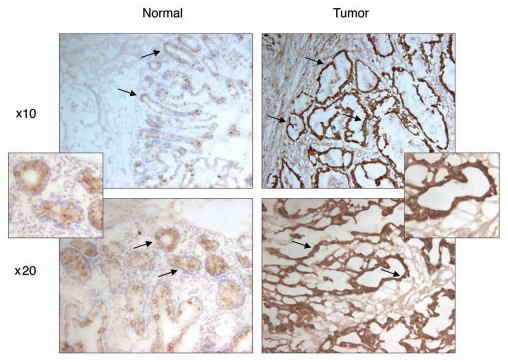
Figure 4.
Immunohistochemical staining of PDRG in matched normal and cancer tissues from colon cancer patients. Frozen primary colon normal and tumor tissues from same patient were sectioned (6 µm) then fixed with 4% paraformaldehyde for 30 min. Endogenous peroxidase was quenched with hydrogen peroxide and the sections were then blocked in PBS with 10% goat sera for 20 min and incubated sequentially with anti-PDRG antibody for 1 hour, biotinylated anti-rabbit secondary antibody (Vector Laboratories, Burlingame, CA) for 45 min and ABC reagent (Vector laboratories) for 30 min. After several washes, the sections were then incubated with peroxidase substrate DAB solution (Vector laboratories) and counterstained with hematoxylin. Brown color indicates the PDRG-specific signal. Photomicrographs from different regions captured at x10 and x20 magnifications are shown. Please note that PDRG1 is predominantly expressed by the epithelial cells as indicated by arrows and the tumor sample exhibits very strong PDRG-specific staining than the matching normal tissue. Insets show sections of enlarged images from x20 photomicrographs.

