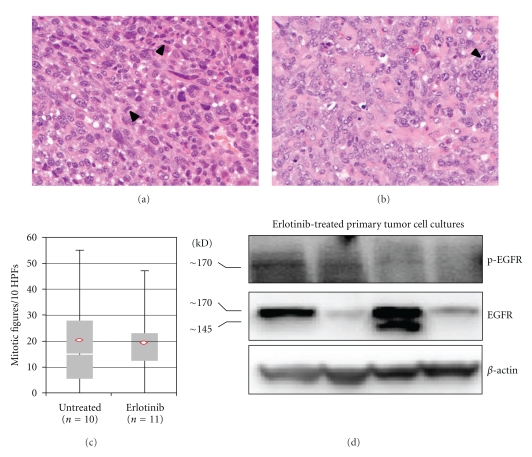
Figure 3.
Histological and biochemical analysis of untreated and Erlotinib-treated tumors. Representative histology of (a) untreated and (b) Erlotinib-treated tumors. (c) Mitotic figures/10 high-power fields for untreated and Erlotinib-treated mice (P = 0.841). (d) Western blots showing the expression and phosphorylation of Egfr in primary tumor cell cultures from Erlotinib-treated mice.

