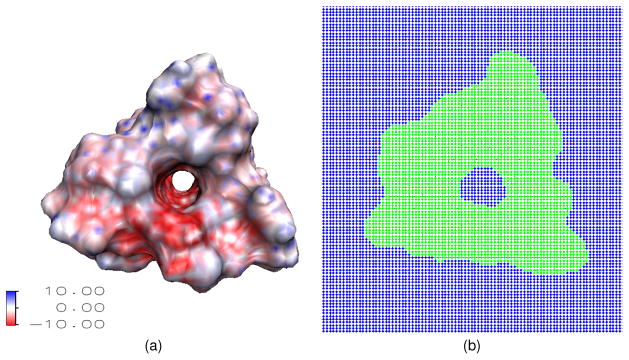
Figure 7.
Illustrations of the Gramicidin A channel structure. (a) A 3D view of the geometric structure of Gramicidin A with surface electrostatic potential. The intensive red color inside channel pore indicated that the pore region is negatively charged, which selects positive ions; (b) A cross section in the xy plane, where green color indicates the protein region and blue color indicates the solvent region.

