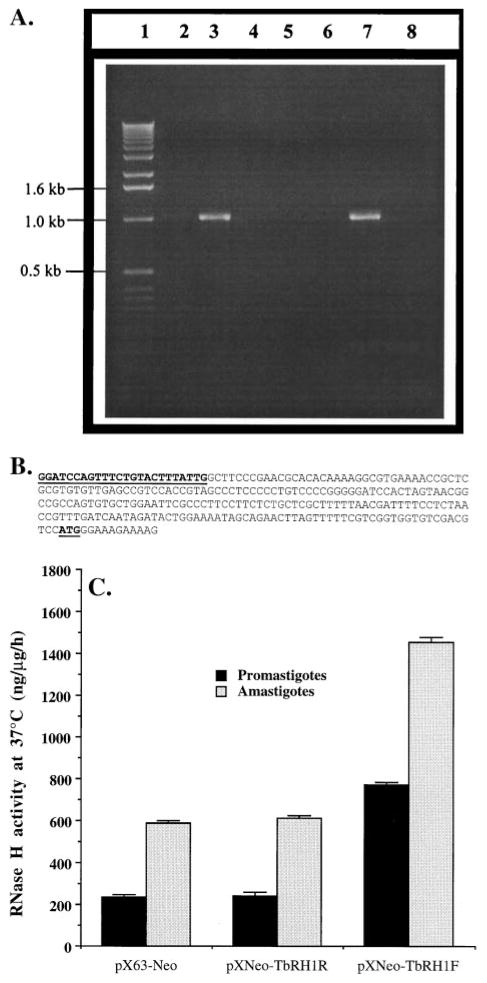
Fig. 2.
Expression of T. brucei RNase H1 in L. amazonensis. (A) Evidence for the presence of T. brucei RNase H1 DNA and mRNA in recombinant L. amazonensis. Lane 1, 1-kb ladder DNA marker (GIBCO); lanes 2 and 3, PCR products from plasmid DNA templates isolated from TbRH1− (lane 2) and TbRH1+ (lane 3) cells; lanes 4–8, RT–PCR data. Lanes 4–6 represent RT–PCR products from RNA(−), RT(−), and AmpliTaq(−) reaction controls; lanes 7 and 8, RT–PCR products from RNA isolated from TbRH1+ and TbRH1− cells, respectively. PCR amplifications were done with TbRHF and TbRHR primers. The identity of the amplified products was confirmed by nucleotide sequencing. The faint DNA band in lane 2 was a PCR artifact. (B) Nucleotide sequence (5′ to 3′) of the miniexon end (261 bp) of the 5′-RACE product with Mex2 and TbRHR. The Mex2 sequence and the RNase H1 mRNA translation start site (AUG) are boldfaced and underlined. (C) Overexpression of RNase H activity in transgenic Leishmania. The plasmids that were used to transfect L. amazonensis cells are shown on the x-axis. RNase H activity in the cell extracts is expressed as nanograms of substrate degraded per microgram of cell extract protein per hour. Results are means ± SEM (N = 3). The difference in RNase H activity between amastigote and promastigote cell extracts was statistically significant (P < 0.01).

