
Figure 2.
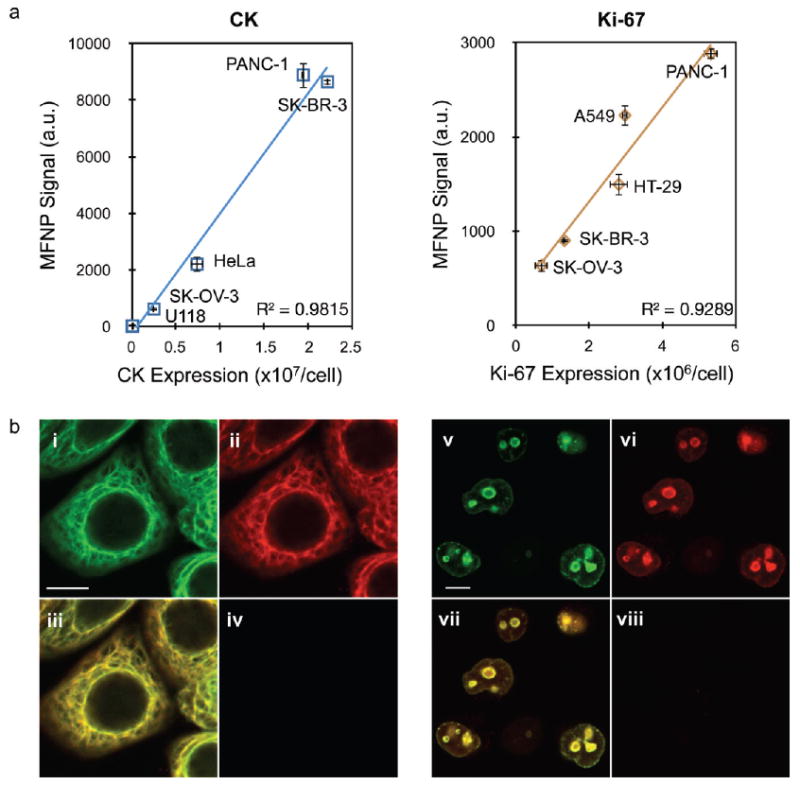
Nanoparticle targeting to intracellular markers is specific and representative of molecular expression level. (a) MFNP fluorescence correlated closely with molecular expression determined by antibody staining for panels of cell lines expressing various amounts of CK and Ki-67. (b) Confocal microscopy images of SK-BR-3 (i–iv) and PANC-1 (v–viii) cells targeted for CK and Ki-67, respectively. In both cases, antibodies were labeled with both TCO (3–4 per antibody) and AlexaFluor-488 fluorescent dye. Following MFNP labeling, images were captured at 488 (antibody, pseudocolored green, i and v) and 680 (MFNP, pseudocolored red, ii and vi) nm emission. Merged images reveal excellent correlation between the two signals (iii and vii). Controls determined using a nonbinding, TCO-modified control antibody were negative (iv and viii). The scale bars in (i) and (v) represent 10 μm. Error bars represent the standard error from at least three independent experiments.