
Figure 3.
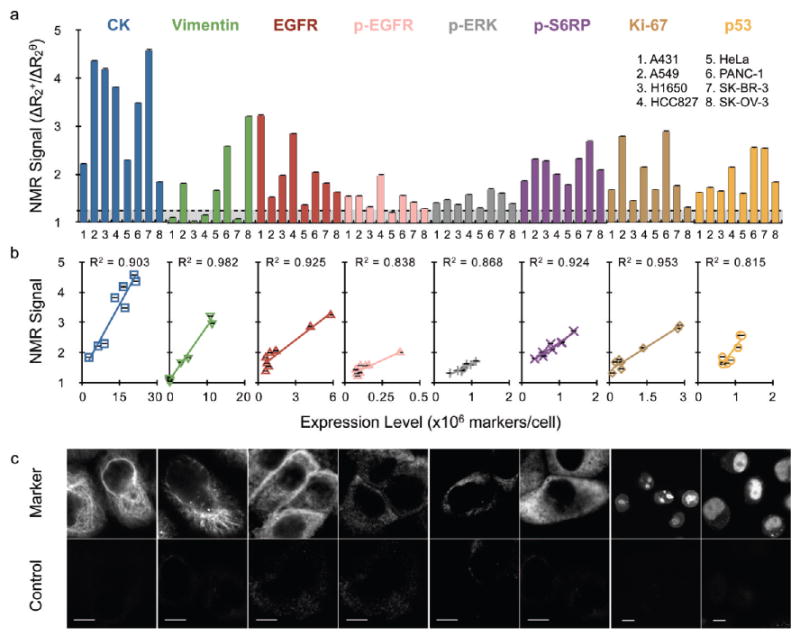
Profiling scant tumor cell populations for key biomarkers of cancer using diagnostic magnetic resonance (DMR). (a) Detection of eight biomarkers in eight different cell lines using MFNP based on nuclear magnetic resonance signal. The transverse relaxation rate (R2) was measured for ∼1000 cells using a miniaturized DMR device. Marker expression levels were determined based on the ratio of the positive marker (ΔR2+) and control (ΔR2θ) signals (see Methods). (b) Magnetic measurements showed excellent correlation with marker expression levels determined independently by antibody staining (see Supporting Information Table S2). (d) Confocal images demonstrating varying cellular localizations and signal intensities obtained for each specific marker (top) and controls (bottom). PANC-1 cells were used for CK, vimentin, p-ERK, p-S6RP, Ki-67, and p53 images. A431 cells were used for both EGFR cases. All scale bars represent 10 μm. Error bars represent the standard error from at least three μNMR measurements. Abbreviations: p-, phosphorylation specific; S6RP, S6 ribosomal protein.