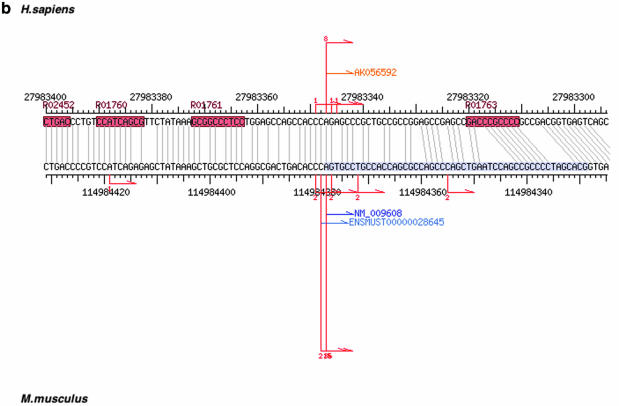
Figure 2.
A comparative view of human and mouse promoters. (a) Global view with potential transcription factor binding sites. Locally similar sequence segments are shown in boxes and the corresponding boxes are represented by the same number (e.g. ‘0’). (b) More detailed view around the corresponding TSSs.


