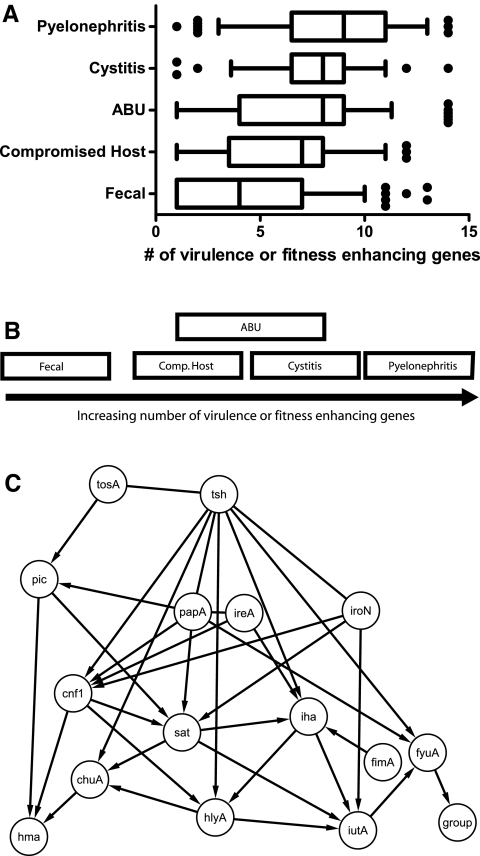
FIG 4 .
Models demonstrating differences and similarities between E. coli isolates from different clinical settings. (A) Under the first model, groups are placed according to the average number of virulence factors as described in a box-and-whisker plot in which the mean is indicated by a vertical line, the 25th and 75th percentiles are indicated by the left and right borders of the box, and the 10th and 90th percentiles are indicated by the whiskers. Dots represent outliers in the analysis. (B) The third model used multivariate ANOVA of the full presence or absence data for each gene to test for differences in gene prevalence rates between all five groups of isolates. Groups shown to overlap cannot be readily differentiated based on the data collected in this study, while those that do not overlap were found to contain different combinations of the genes under study. (C) Bayesian model of unique connections between virulence and fitness factor genes. The presence or absence of each gene in each of 314 strains was modeled to identify a consensus network of the genes. Knowledge of the presence or absence of a given gene predicts the presence or absence of another gene. Arrows indicate directed edges linking two variables together in the network.

