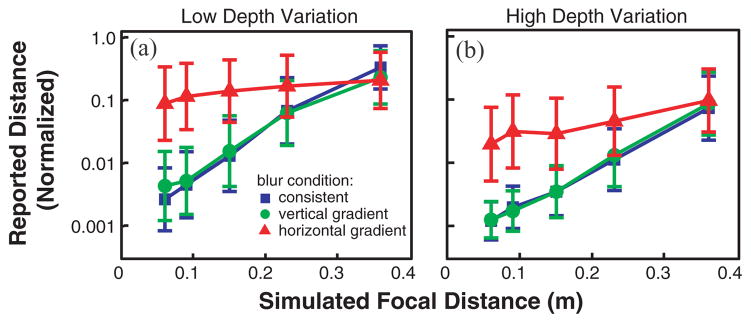
Fig. 12.
Results of the psychophysical experiment averaged across the seven subjects. Panels (a) and (b) respectively show the data when the images had low and high depth variation. The type of blur manipulation is indicated by the colors and shapes of the data points. Blue squares for consistent blur, green circles for vertical blur gradient, and red triangles for horizontal blur gradient. Error bars represent standard errors. Individual subject data are included in the supplemental material.

