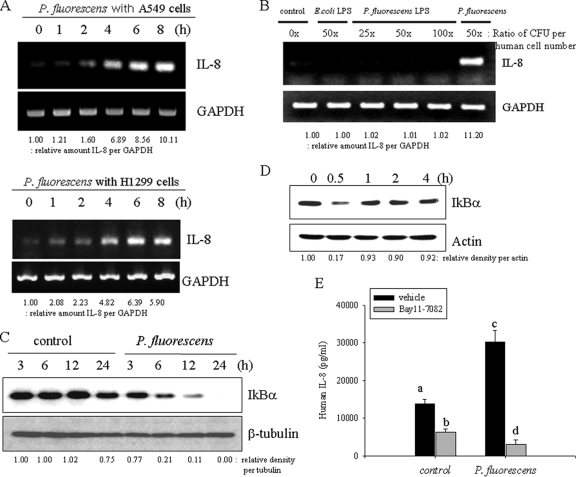
Fig. 1.
Prolonged induction of epithelial IL-8 by P. fluorescens. (A) A549 cells grown to 90% confluence were infected with P. fluorescens at a cell-to-bacterium ratio of 1:50 for each time period. Each mRNA was measured using RT-PCR. (B) P. fluorescens and 2 μg/ml LPS from P. fluorescens and E. coli were individually incubated with A549 cells. The amount of LPS was administered with the equivalent dose of live bacteria (CFU). Each mRNA was measured using RT-PCR. (C) A549 cells were infected with P. fluorescens for each time period. Cell lysate of each sample was subjected to Western blot analysis. (D) A549 cells were treated with LPS (dose equivalent to 50× ratio of P. fluorescens CFU per human cell number) from P. fluorescens for each time period. Cell lysate of each sample was subjected to Western blot analysis. (E) A549 cells were pretreated with 20 μM BAY 11-7082 for 2 h and infected with P. fluorescens at a cell-to-bacterium ratio of 1:50 for 12 h. IL-8 release was measured by ELISA. A different letter over each bar represents a significant difference between two group (P < 0.05).

