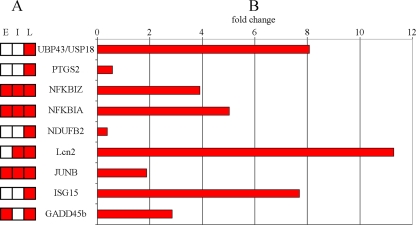
Fig. 2.
Confirmation of microarray results by RT-PCR. Nine DEGs and their expression profiles are shown. The time points at which the differential expression was detected are shown schematically for each gene (A), and the RT-PCR result for each gene is represented as fold change (B). The RT-PCR analyses were performed on RNA extracted from infections in the late time period.

