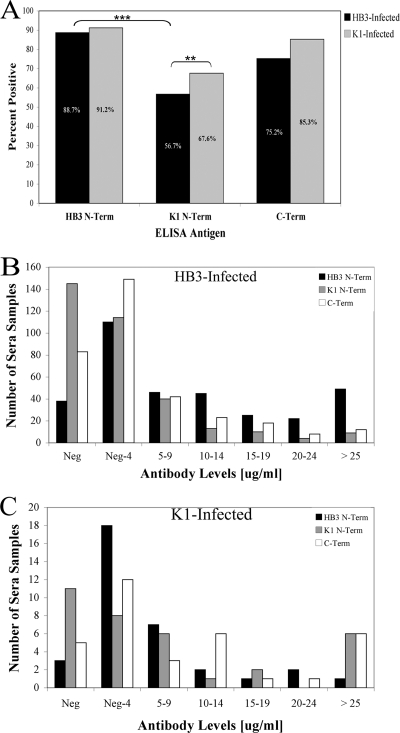
Fig. 2.
Distribution of anti-PfMSP3 responses in HB3- and K1-infected individuals. (A) Percent positive responses, by infected allele, either HB3 (N = 335) or K1 (N = 34), for each PfMSP3 domain antigen. Responses were scored positive if they were three standard deviations above the mean of a negative-control pool of serum from individuals who had never been infected with P. falciparum. Negative cutoff values for each antigen are listed in Materials and Methods. The double and triple asterisks denote P = 0.016 and P < 0.0001, respectively. (B and C) Number of individuals who exhibit given IgG antibody levels (in micrograms per milliliter) against each PfMSP3 domain antigen in HB3- (B) and K1-infected (C) individuals. Neg shows number of samples below the negative cutoff values, which are listed in Materials and Methods. Neg-4 are samples less than 5 μg/ml but greater than the negative cutoff, 5–9 are samples from 5 to 9 μg/ml above the negative cutoff, and so on.

