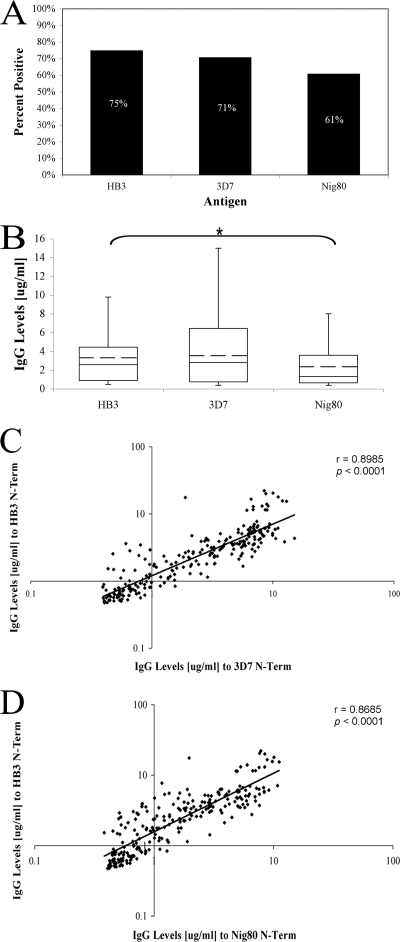
Fig. 5.
Anti-PfMSP3 N-terminal domain responses across variants within the 3D7 allele class. (A) Percent positive responses of ELISA-positive HB3-infected individuals (n = 242) against 3D7 class mutants 3D7 and Nig80. (B) IgG antibody levels (in micrograms per milliliter) against 3D7 class mutants. The whiskers denote the upper and lower quartiles. The mean is denoted by the hashed line. *, P = 0.001. (C and D) Pairwise correlation between anti-HB3 responses and either anti-3D7 (C) or anti-Nig80 (D) antibody responses; the black line indicates a best-fit exponential line.

