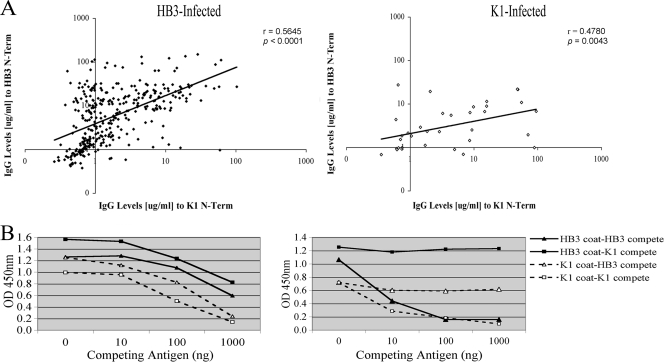
Fig. 6.
Anti PfMSP3 N-terminal (N-Term) domain responses across allele classes. (A) Pairwise correlation between anti-HB3 and anti-K1 antibody responses separated on the basis of their infecting PfMSP3 allele; the black line indicates a best-fit exponential line. n = 369. (B) Competition ELISAs were performed using titrating amounts of competing antigen (0 to 1,000 ng) to assess cross-reaction; some samples showed evidence of cross-reactivity (left panel), while others showed only allele-specific responses (right panel).

