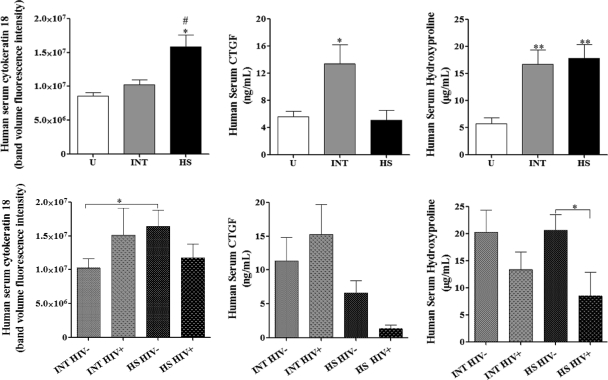
Fig. 3.
Human serum analysis. Human serum cytokeratin 18, CTGF, and hydroxyproline comparisons for INT and HS and within the groups separated by HIV-1 coinfection status. Means ± SEM are shown. ANOVA, P ≤ 0.01 for all biomarkers. Posttest group comparisons were performed by Newman-Keuls multiple-comparison test: #, P ≤ 0.05 compared to uninfected human sera (U); ##, P ≤ 0.01 compared to INT sera; *, P ≤ 0.05 compared to uninfected human and HS sera; **, P ≤ 0.01 compared to uninfected human sera; *, P ≤ 0.05 for HIV-1 serostatus comparison.

