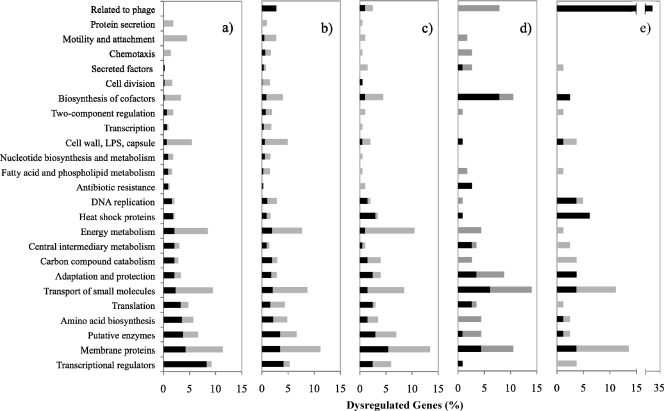
Fig. 2.
PseudoCAP functional class distribution of nonhypothetical genes with altered expression in response to tobramycin. (a) PAO1 lethal aerobic. (b) PAO1 lethal anaerobic. (c) asrA::lux mutant lethal aerobic. (d) PAO1 subinhibitory aerobic. (e) PAO1 inhibitory anaerobic. Black bars indicate upregulation, and gray bars indicate downregulation. LPS, lipopolysaccharide.

