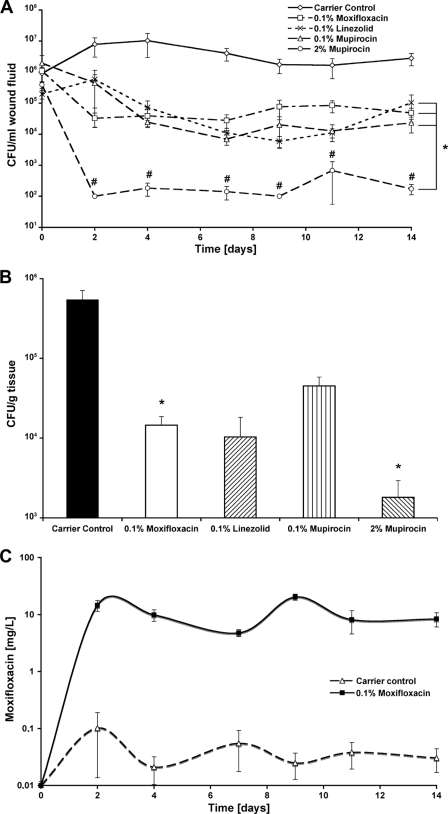
Fig. 3.
Bacterial counts of MRSA-infected porcine wounds. (A) The time-dependent change of bacterial counts within the sampled wound fluids is shown. All treatment groups showed reduced bacterial levels over time that remained beneath the infection level during the complete follow-up. Complete bacterial clearance was seen only when 2% mupirocin was applied to the wounds. Bacterial counts were significantly reduced in all treatment groups compared to carrier control. *, P < 0.05, 0.1% moxifloxacin, 0.1% linezolid, 0.1% mupirocin, and 2% mupirocin versus carrier control; #, P < 0.05, 2% mupirocin versus 0.1% moxifloxacin, 0.1% linezolid, or 0.1% mupirocin. Endpoint measurements of MRSA tissue counts are shown (B). Therefore, punch biopsy specimens were taken, homogenized, and serially plated 14 days after treatment start. Bacterial counts were significantly reduced only after 0.1% moxifloxacin or 2% mupirocin treatment, while only 2% mupirocin showed a partial remission of bacterial counts (values below detection limit of 102). All treatment groups demonstrated bacterial reduction below infection level (105 CFU/g of tissue). *, P < 0.05, 0.1% moxifloxacin and 2% mupirocin versus carrier control. (C) The ratio between the bacterial counts within the wound fluid and the corresponding amount of moxifloxacin, which was detected by LC-MS/MS analysis, for the complete follow-up of 14 days. These correlations discriminate the treatment group from the control group and demonstrate the relation between moxifloxacin concentration and bacterial reduction. The values are shown as mean ± SEM. The moxifloxacin concentration at the level of the x axis indicates the detection limit of the measurement.

