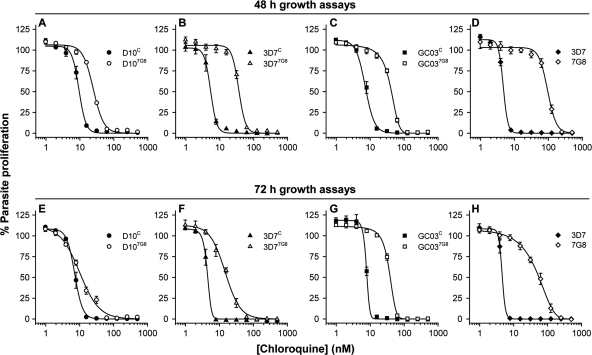
Fig. 4.
The effect of increasing CQ concentrations on parasite proliferation, as assessed using 48-h (A to D) and 72-h (E to H) [3H]hypoxanthine incorporation assays. Data, averaged from 3 to 6 experiments and shown as means ± SEM, are presented for the D10C and D107G8 lines (A and E), the 3D7C and 3D77G8 lines (B and F), the GC03C and GC037G8 lines (C and G), and the nontransfectant 3D7 and 7G8 lines (D and H). Data for lines expressing 7G8 PfCRT and wild-type PfCRT are shown with open symbols and closed symbols, respectively. Where not shown, error bars fall within the symbols.

