Fig. 5.
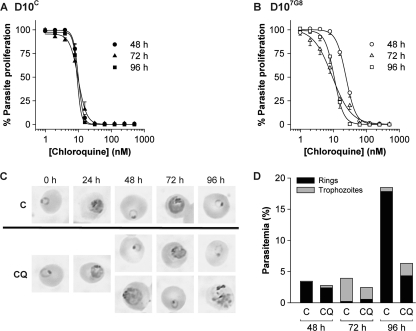
The effect of increasing CQ concentrations on parasite proliferation in D10C (A) and D107G8 (B) parasites, as assessed using 48-h (circles), 72-h (triangles), and 96-h (squares) [3H]hypoxanthine incorporation assays. Data are averaged from four independent experiments and are shown as means ± SEM. For clarity, only positive error bars are shown for D10C, and only negative error bars are shown for D107G8. Where not shown, error bars fall within the symbols. (C) Giemsa-stained smears of untreated (control [“C”]) D107G8 parasites (top) and of D107G8 parasites treated with 15 nM CQ (bottom) at various time points following the start of CQ exposure. Where two photos are shown for one time point and condition, they represent parasite stages that were both present in significant numbers. (D) Parasitemias of untreated (“C”) and CQ (15 nM)-treated cells and proportions of ring-stage parasites and trophozoite-stage parasites at the 48-h, 72-h, and 96-h time points in the experiment from which the micrographs in panel C were obtained.

