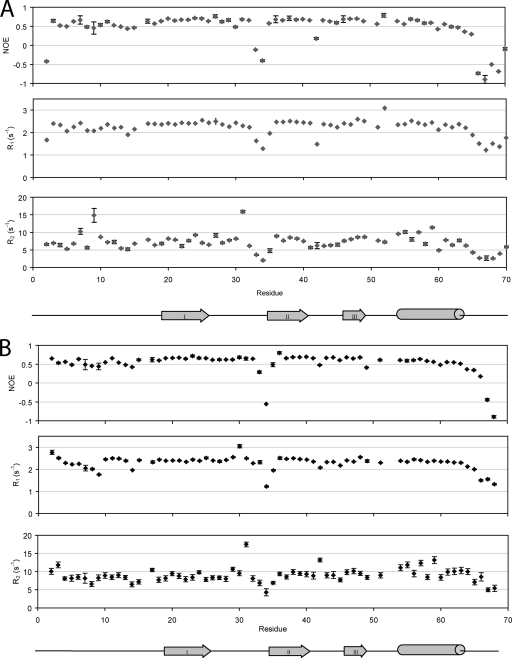
Fig. 3.
1H-15N NMR spin-relaxation data of NAP-2 (A) and TC-1 (B). The plots consist of heteronuclear NOE ratios (top), R1 (middle), and R2 (bottom) relaxation rates. The secondary structure profiles beneath are based on the solution structure of monomeric NAP-2 (61).

