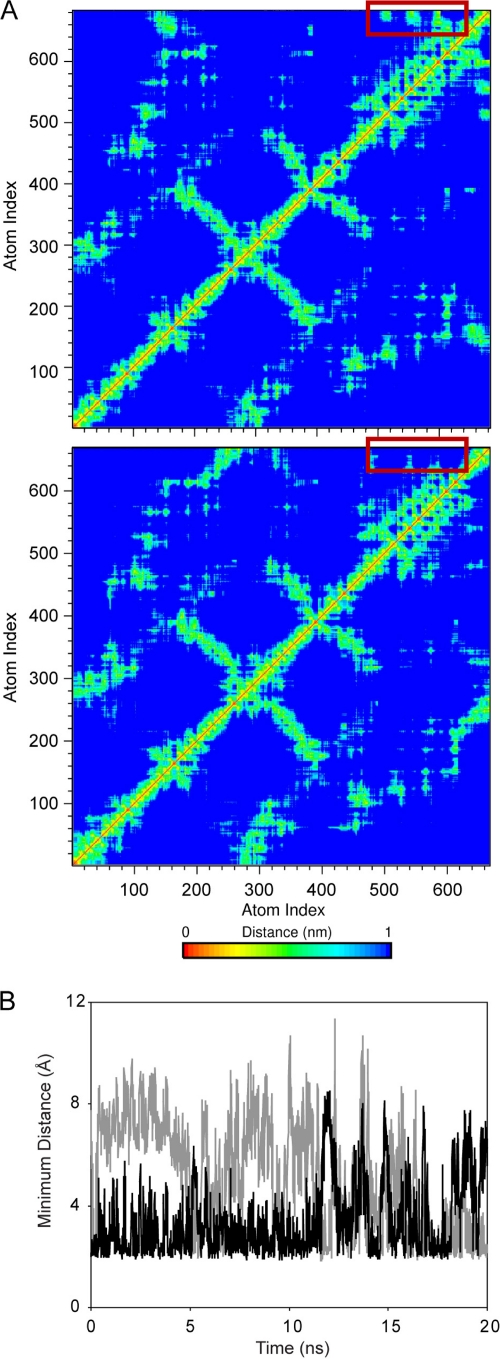
Fig. 5.
MD simulation results for the NAP-2 and TC-1 chemokines. (A) Representative distance plots averaged using the NMR 1/r6 distance dependence for NAP-2 (top panel) and TC-1 lower panel. The additional two residues in NAP-2 form considerable contacts with the α-helix during the protein (red boxes). These contacts are absent in the TC1 trajectory due to the lack of Asp70. (B) The minimum distance between Asp70 of NAP-2 and Lys57 (black) and Lys61 (gray) illustrating the pronounced electrostatic interactions that take place between the far C terminus and the α-helix.

