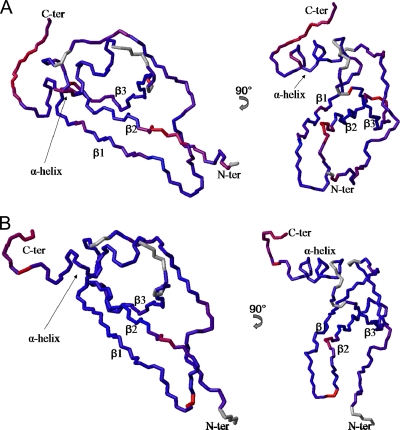
Fig. 6.
Backbone chains of NAP-2 (A) and TC-1 (B) with residues colored along a gradient according to their S2 order parameters. Red and blue residues represent high and low extremes in flexibility, respectively, with purple representing intermediate flexibility. Residues for which no S2 values were assigned are colored in gray. The structure models are based on a combination of the NAP-2 crystal structure (PDB ID 1NAP) and the solution structures of the corresponding C-terminal α-helix peptides solved previously (39).

