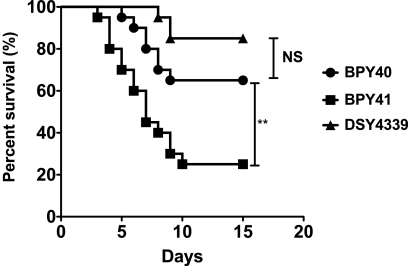
Fig. 1.
Survival curves for neutropenic mice infected with BPY40 and mitochondrial mutants BPY41 and DSY4339. Statistical differences were determined using the Mantel-Cox log rank test (Prism 5.0) by comparing survival curves of mice infected with BPY40 and with other strains as indicated. Asterisks indicate statistically significant differences (**, P < 0.01; NS: not significant).

