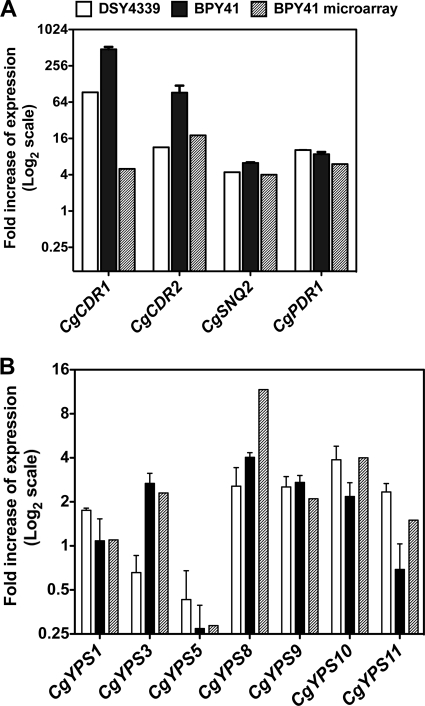
Fig. 5.
Relative gene expression levels of selected genes in C. glabrata isolates. (A) Expression of genes involved in azole resistance in BPY41 and DSY4339 as measured by qRT-PCR. Values are averages from three independent experiments and represent increase in gene expression relative to that in the azole-susceptible strain BPY40 (set at 1.00). qRT-PCR was performed as described by Sanguinetti et al. (35) for CgCDR1, CgCDR2, CgSNQ2 and as described by Ferrari et al. (14) for CgPDR1. Relative expression of genes in BPY41 obtained by microarray analysis is plotted for comparison. (B) CgYPS gene expression in BPY41 and DSY4339 as measured by qRT-PCR. Values are averages from three independent experiments and represent increase in gene expression relative to that in the azole-susceptible strain BPY40 (set at 1.00). No qRT-PCR data were available for CgYPS1 and CgYPS7. Relative expression of CgYPS genes in BPY41 obtained by microarray analysis is plotted for comparison.

