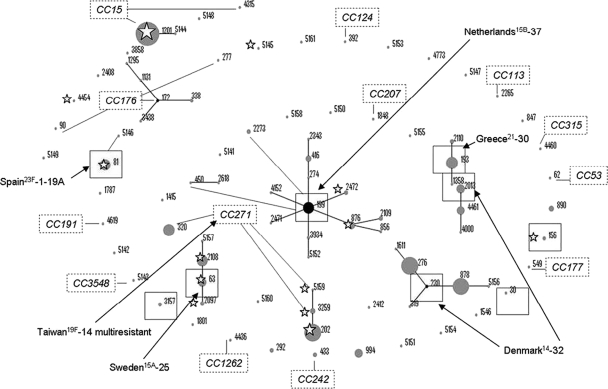
Fig. 1.
Population snapshot of the 514 serotype 19A isolates from the period 1990 to 2008. Clusters of related and unrelated STs are displayed as an eBURST diagram. STs are displayed graphically, with distances between STs based on number of SLVs between them. Dot sizes represent number of isolates. Founder STs are in boxes, primary founders (black dots) are positioned centrally in the cluster, and subgroup founders are shown as gray dots. Related outer primary founders of clonal complexes are labeled with open rectangles. STs found before the 2000s are marked with a star. Relationships with PMEN clones are indicated with arrows.

