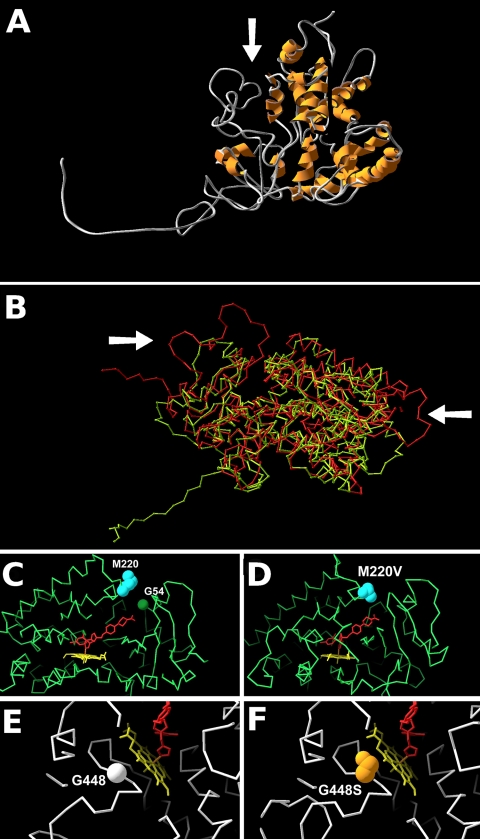
Fig. 1.
Models of CYP51A and azole resistance-associated amino acid variants. The protein CA (alpha carbon) backbone is shown in either green or white, heme is shown in yellow, and the inferred azole position for ketoconazole is shown in red. (A) Predicted structure of the Af293 CYP51A protein showing the active-site cleft (arrow). (B) Superimposed structures of Af293 CYP51A derived using human 3JUS (green CA trace) and m. tuberculosis 1eae (red ca trace). the arrows show regions of significant divergence between the models, including in the region of the access cleft (left arrow). (c) slab section (30 Å thick) showing the active-site cleft, with the ketoconazole position derived from 3jus. the wild-type positions of m220 and g54 are marked. (d) slab (30 Å) showing the active-site cleft, with the ketoconazole position derived from 3jus. the azole-resistant m220v mutation is marked. (e, f) slab (20 Å) showing the predicted position of the heme molecule. the wild-type g448 residue (e) is shown with the azole-resistant g448s residue (f).

