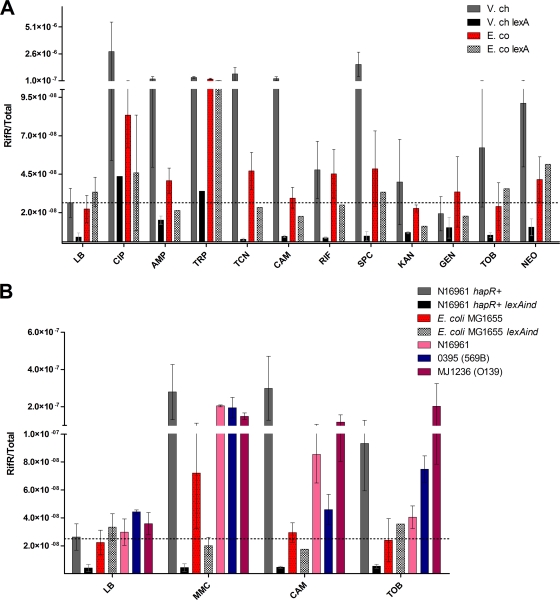
Fig. 2.
Spontaneous mutation frequency after treatment with subinhibitory concentrations of antibiotics. Bacteria were grown as described in Fig. 1. Appropriate dilutions were plated on Luria broth, and 1 ml of culture was centrifuged and plated on 100-μg/ml rifampin plates. The mutation frequency, corresponding to the rifampin-resistant CFU count over the total number of CFU, was measured and represented on the y axis for each antibiotic. (A) E. coli MG1655 and V. cholerae N16961 hapR+. (B) Comparison of various V. cholerae strains.

