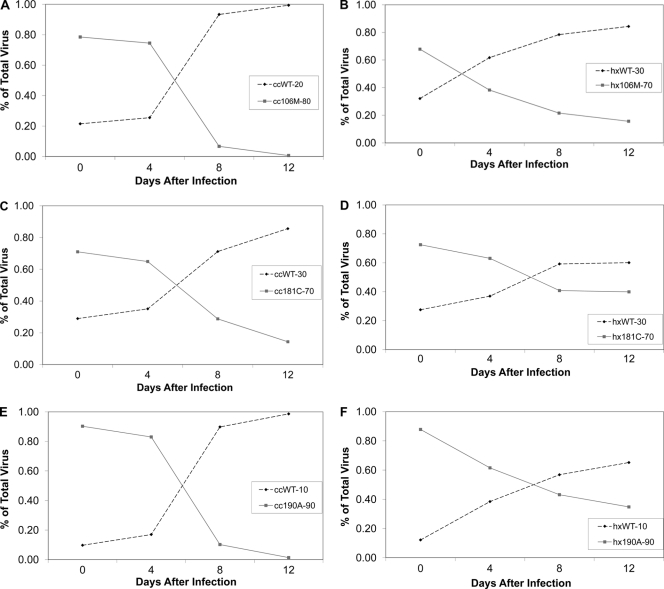
Fig. 1.
Representative competitions of NNRTI drug resistance mutations in the consensus C RT and the subtype B RT competed with the WT. (A) Relative growth curve of the 106M mutant with the WT in the consensus C background, where the mutant makes up 80% of the inoculum and the WT is the remaining 20%. (B) Competition similar to that represented in panel A, except in the subtype B background, where the 106M mutant is at 70% and the WT starts at 30%. (C) Competition between the WT and the 181C mutant at an initial ratio of 30% WT to 70% mutation in the consensus C background. (D) Competition between the 181C mutant and the WT with an initial ratio of 30% WT to 70% mutation in the subtype B background RT sequence. (E) Consensus C competition between the 190A NNRTI mutant and the WT with an inoculum that is 10% WT and 90% mutant. (F) Competition between the 190A mutant and the WT in the subtype B background with an initial ratio of 10% WT to 90% mutant. “cc” signifies the consensus C RT, and “hx” indicates that the subtype B RT was used.

