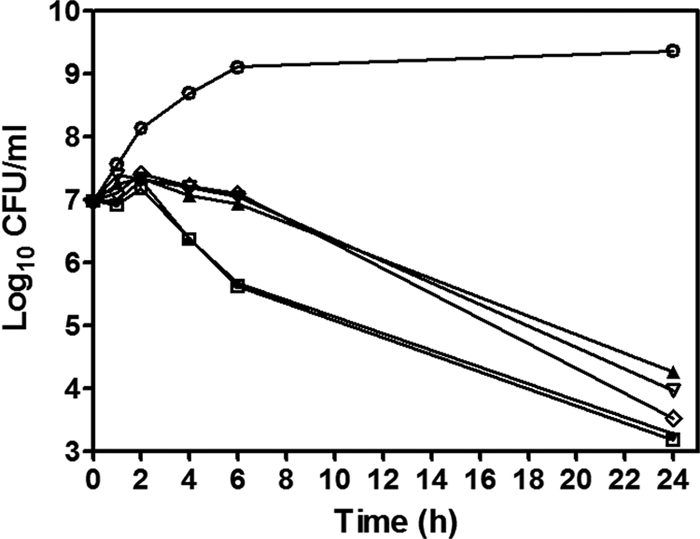
Fig. 6.

Time-kill curve of S. aureus incubated with AM-165. S. aureus ATCC 25923 was incubated with vehicle alone (e.g., DMSO) (○) as a growth control; AM-165 at 1× the MIC (▴), 2× the MIC (▿), 4× the MIC (♢), and 8× the MIC (▵); or vancomycin at 2× the MIC (□) and 4× the MIC (●) and sampled at the indicated time points. The log10 values of CFU/ml were plotted versus time as described in Materials and Methods. The data shown are from one of three independent experiments with similar results.
