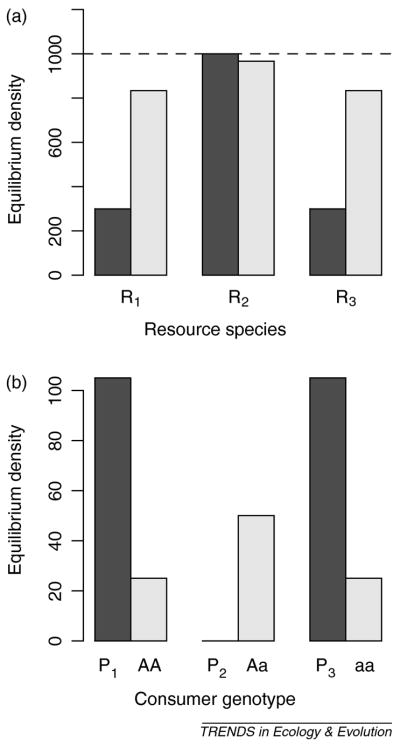
Figure 1.
Equilibrium abundance of three consumer genotypes (B: asexual, dark bars; sexual, light bars) and their respective three prey resources (A). In (A) a horizontal line indicates the carrying capacity of all three resources (K = 1000). All parameters are identical across consumer-resource pairs (r = 1.5, a = 0.01, b = 0.05, d = 0.15) except that P2 (sexual genotype Aa) has attack rate a = 0.001.

