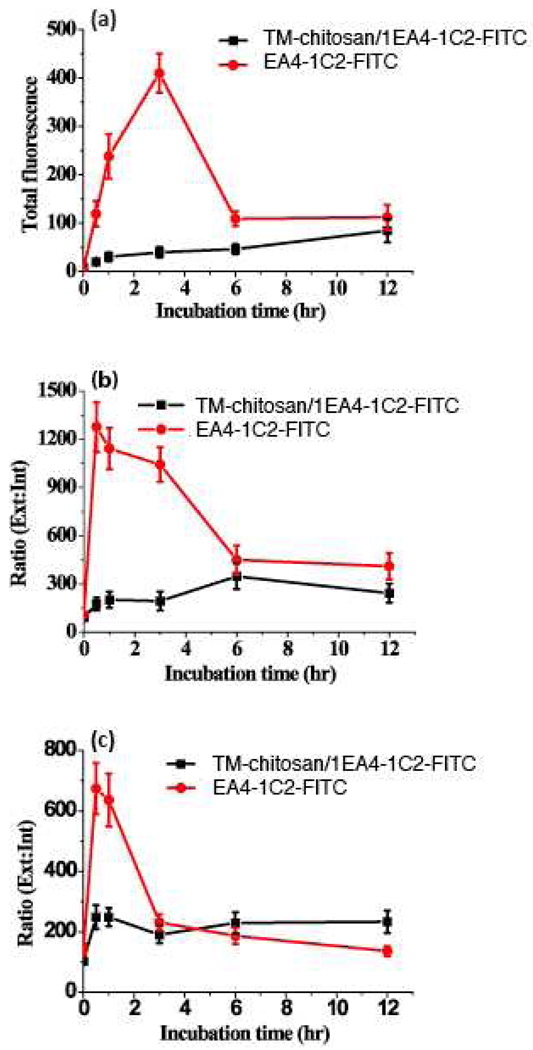
Figure 3.
The fluorescence intensity of TM-chitosan/1E4-1C2-FITC and 1E4-1C2-FITC plots as a function of time. HepG2 cell incubated with TM-chitosan/1E4-1C2-FITC and 1E4-1C2-FITC in various time and then, the total fluorescence intensity were recorded (a). The ratio of external to internal fluorescence intensity of TM-chitosan/1E4-1C2-FITC and 1E4-1C2-FITC were measured (b). In saturation with 1E4-1C2, the total fluorescence intensity of TM-chitosan/1E4-1C2-FITC and 1E4-1C2-FITC in cell were recorded (c).

