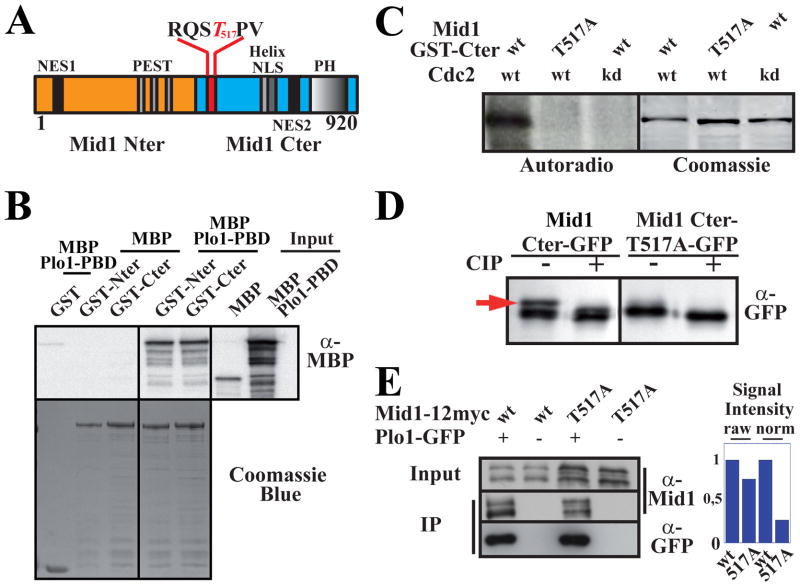
Figure 1. Plo1 binding to Mid1 involves two sites and is favored by Cdc2 phosphorylation of threonine 517 within the RQST517PV consensus.
A: Mid1 molecule (Nter, orange; Cter, blue). The consensus Plo1 binding site RQSTPV is detailed with phospho-T517 in red.
B: In vitro binding of Plo1 PBD (MBP-Plo1-PBD) on Mid1 Nter and Cter (GST-Nter, aa 1–422; GST-Cter, aa 443–920). Top: MBP-Plo1-PBD and MBP (negative control) were revealed using α-MBP Abs. Bottom: loading controls (coomassie blue staining).
C: Cdc2 kinase assay on Mid1 Cter. Left: Mid1 GST-Cter (aa 443–920) or GST-T517A-Cter were incubated with Cdc2 and Cdc2 kinase dead (kd). Phosphorylation is detected by 32P autoradiography. Right: loading controls (coomassie blue staining).
D: Migration pattern of Mid1 Cter-GFP (aa 501–920) and Cter-T517A-GFP immunoprecipitated with an anti-GFP mAb and treated or not with CIP. WB: anti-GFP mAb. Red arrow: phospho-Cter-GFP.
E: Coimmunoprecipitation of Mid1-12myc or Mid1-T517A-12myc with Plo1-GFP. IPs and WB for Plo1-GFP were performed with an anti-GFP mAb. Mid1 was detected using anti-Mid1 affinity purified Ab (α-Mid1). Negative controls: anti-GFP IPs on extracts from cells expressing untagged Plo1. Right: signal quantification. Raw signals of Mid1-12myc and Mid1-T517A-12myc in Plo1-GFP IP samples (left). Normalized signals relative to Mid1 and Mid1-T517A concentration in input (2.8 ratio; right).
See also Figure S1.

