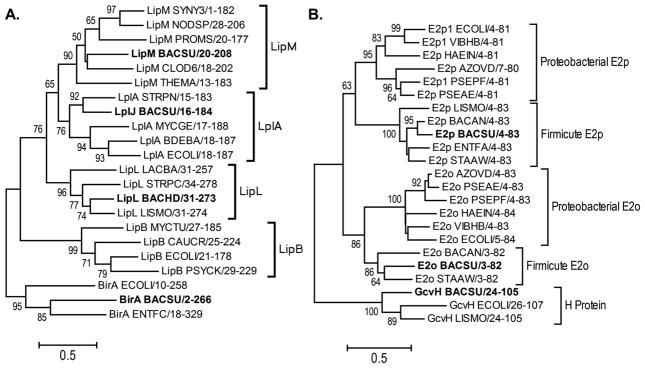
Fig. 8.
Minimum evolution analysis of alignments with bootstrap percentage values shown for each branch. The trees are drawn to scale, with branch lengths in the same units as those of the evolutionary distances used to infer the phylogenetic tree. The scale represents a 50% difference in compared residues per length. Branches representing Bacillus proteins are indicated in bold. Panel A: Analysis of selected catalytic domains from PF03099 the structurally related biotin ligases are used as the out-group. Panel B: Selected lipoyl domains involved in lipoic acid metabolism are shown.

