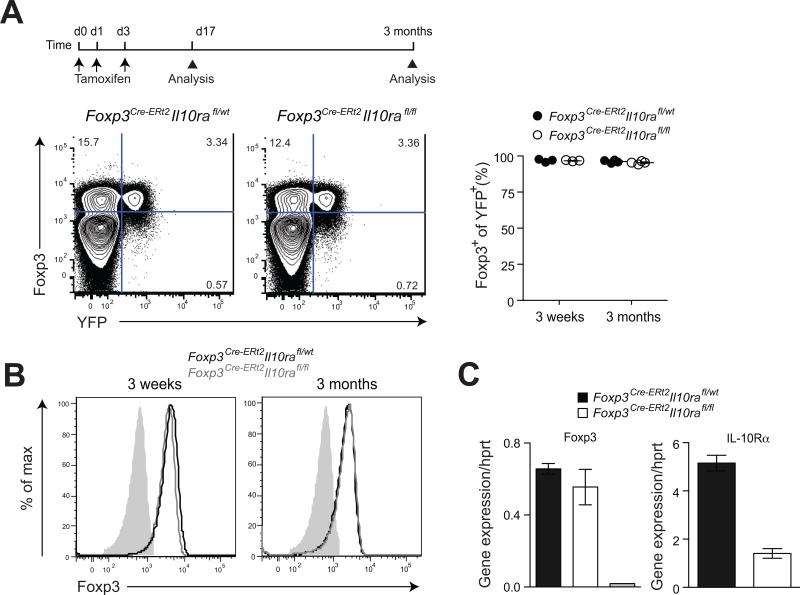
Figure 3. IL-10R ablation does not affect Foxp3 expression and Treg cell lineage stability.
(A) Flow cytometric analysis of Foxp3 and YFP expression on splenic CD4+ T cells in Foxp3CreIl10rafl/flR26Y and control littermate mice. (B) Expression of Foxp3 in flow cytometry-sorted CD4+YFP+ T cells from indicated mice. (C) Quantitative PCR (qPCR) analysis of Foxp3 and IL-10Rα expression in flow cytometry-sorted CD4+YFP+ T cells. The grey bar represents CD4+YFP- T cells. The results represent the mean+/-SD of relative expression values for the indicated genes relative to hypoxanthine-guanine phosphoribosyl transferase. Data are representative of three independent experiments.

