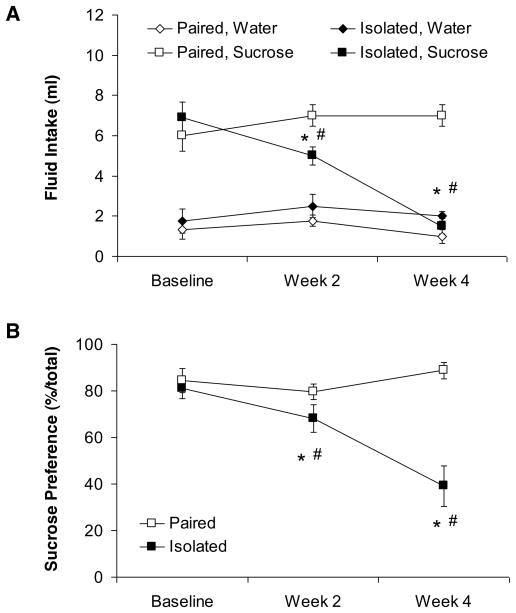
Figure 1.
Mean (± SEM) absolute fluid intake (Panel A) and sucrose preference (Panel B) at baseline and following 2 and 4 weeks of social isolation or pairing. *P < 0.05 vs. respective paired value; #P < 0.05 vs. respective baseline value. Statistical significance symbols are displayed below the respective data point in Panel B.

