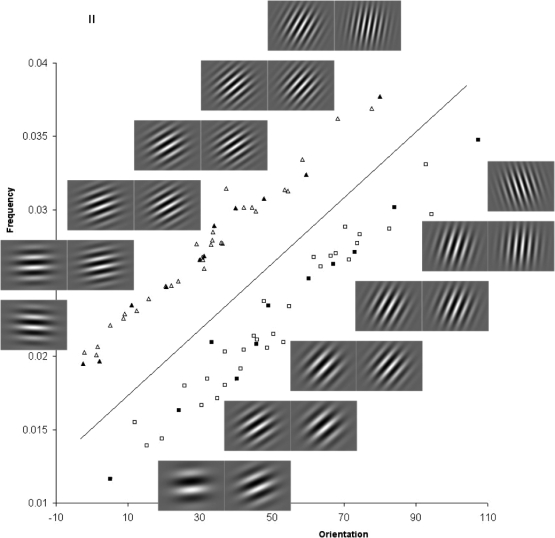
Fig 2.
Stimuli for the information-integration (II) task, including cropped Gabor images for selected exemplars (filled symbols). Category A and B stimuli are represented by triangles and squares, respectively. Orientation and frequency are plotted on the x and y axes, respectively. The solid line represents the optimal decision bound.

