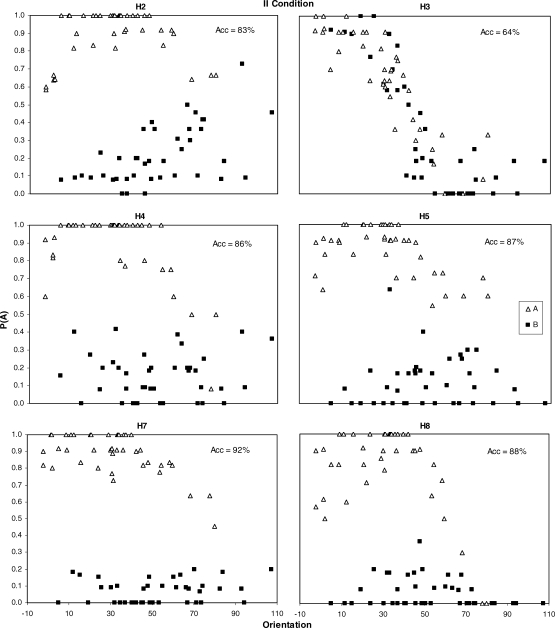
Fig 5.
Probability of a Category A response (p(A); y axis) as a function of orientation (x axis) for the II condition, shown separately for Category A (unfilled triangles) and Category B (filled squares) stimuli. Each panel shows data for an individual pigeon averaged over the last 10 sessions of training.

