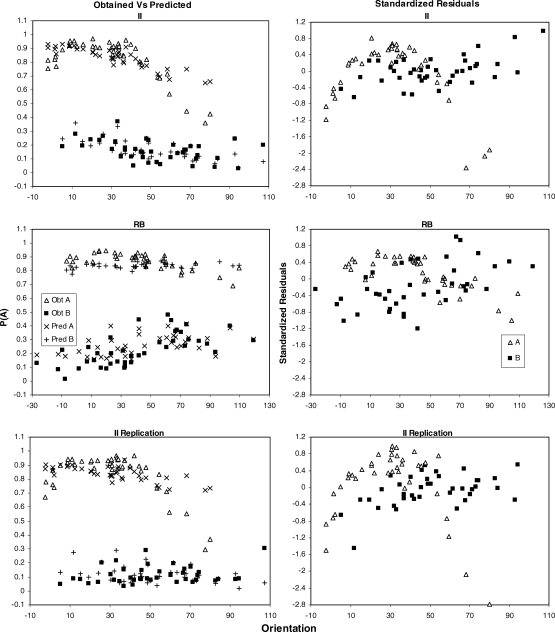
Fig 8.
The left column shows obtained probability of a Category A response (p(A); y axis) as a function of p(A) predicted by the General Linear Classifier (GLC; x axis), for the average data from the II condition (upper panel), RB condition (middle panel), and II replication condition (lower panel). Obtained data for Category A and B are shown by unfilled triangles and filled squares, respectively. Predictions of the GLC for Category A and B are shown by x's and +'s, respectively. The right column shows the standardized residuals from the GLC fits (y axis) plotted as a function of orientation (x axis).

