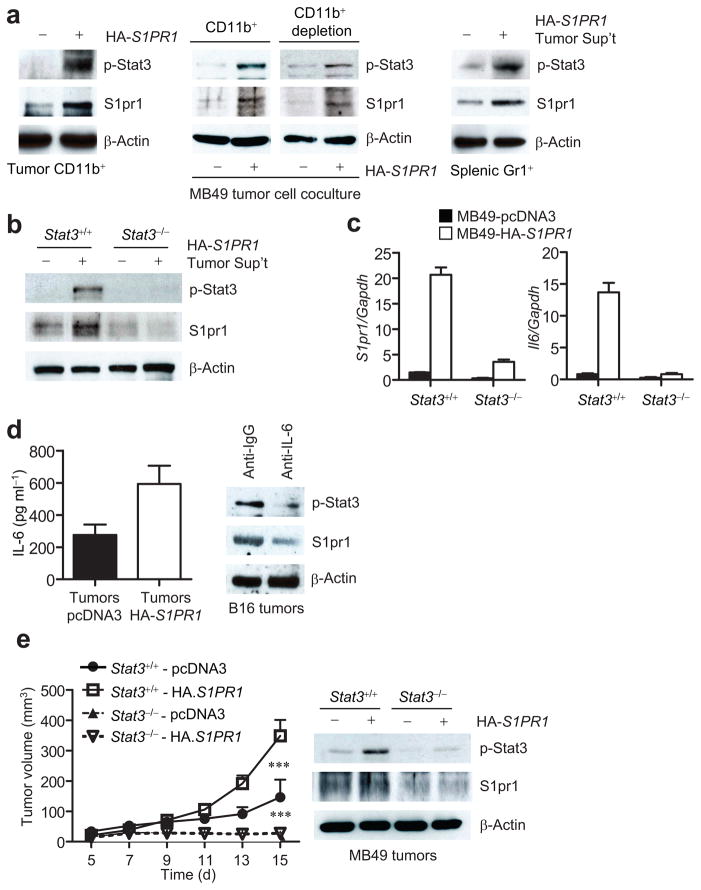
Figure 4.
Elevated S1PR1 expression in tumor cells increases Stat3 activation and S1pr1 expression in tumor-infiltrating myeloid cells. (a) Western blotting showing p-Stat3 and S1pr1 levels in tumor-infiltrating CD11b+ cells from MB49 tumors (left); in splenic CD11b+ and CD11b− (CD11b+ depleted) subsets co-cultured with MB49 tumor cells expressing either control or S1PR1 vectors (middle); in Gr1+ cells incubated in medium with ex vivo cultured supernatant of S1PR1-expressing MB49 tumors. (b) Western blotting to quantify S1pr1 and p-Stat3 levels in Stat3+/+ and Stat3−/− splenocytes cultured in media supplemented with the same tumor supernatants as in (a). (c) Real-time RT-PCR showing RNA expression levels of S1pr1 and Il6 in Stat3+/+ and Stat3−/− myeloid cells exposed to medium supplemented with tumor supernatants transfected with either control (black bars) or S1PR1-expressing (white bars) vectors, means ± s.e.m., n = 3. (d) Left, ELISA to determine IL-6 production by ex vivo cultured tumor cells from indicated tumors; means ± s.e.m., n = 3. Right, Western blotting of S1pr1 and p-Stat3 in ex vivo cultured B16 tumors incubated with control and IL-6 neutralizing antibody. (e) Left, growth curve of MB49 tumors in mice with Stat3+/+ and Stat3−/− myeloid cells; means ± s.e.m., n = 6. ***, P<0.001. Right, Western blotting measuring p-Stat3 and S1pr1 protein levels in tumors.

