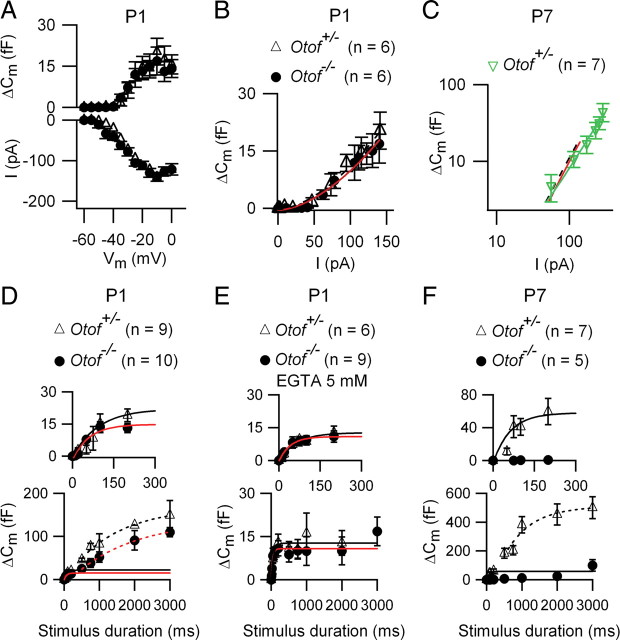
Figure 2.
Properties of otoferlin-independent exocytosis in immature IHCs. A, ICa–voltage relationship and corresponding ΔCm in IHCs from control (triangles) and Otof−/− (circles) P1 mice. B, Corresponding synaptic transfer function plot (ΔCm against ICa amplitude, up to ICa peak). Lines are power function fits with N = 1.6 and N = 1.8 in control (dashed line) and Otof−/− (solid line) IHCs. C, Synaptic transfer function for IHCs from P7 control mice (power fit: N = 1.6), plotted on log scales. D, Kinetics of vesicle pool depletion in P1 IHCs. ΔCm is plotted as a function of the stimulus duration for a step to −10 mV, from a holding potential of −80 mV. Solid lines correspond to a single exponential fit of RRP (inset, between 0 and 200 ms) and dashed lines to another single exponential fit of SRP (500–3000 ms). Fit parameters were for RRP, τ = 48 and 63 ms, ΔCm(max) = 20.8 fF and 16.2 fF, and for SRP, τ = 1363 and 1739 ms, ΔCm(max) = 167 fF and 138 fF in control (black) and Otof−/− (red) IHCs, respectively. E, Kinetics of exocytosis in the presence of 5 mm EGTA in P1 IHCs. Note the block of SRP in the presence of EGTA. Fit values were as follows: τ = 77 ms, ΔCm(max) = 13 fF (control) and τ = 45.5 ms, ΔCm(max) = 11 fF (Otof−/−). F, Absence of fast exocytosis in IHCs from Otof−/− P7 mice, while residual slow vesicular release was still observed. Fit values for IHCs from control mice τ = 29 ms, ΔCm(max) = 56 fF for RRP, and τ = 1000 ms, ΔCm(max) = 526 fF for SRP. Black and red lines are fits for IHCs from control and Otof−/− mice, respectively.

