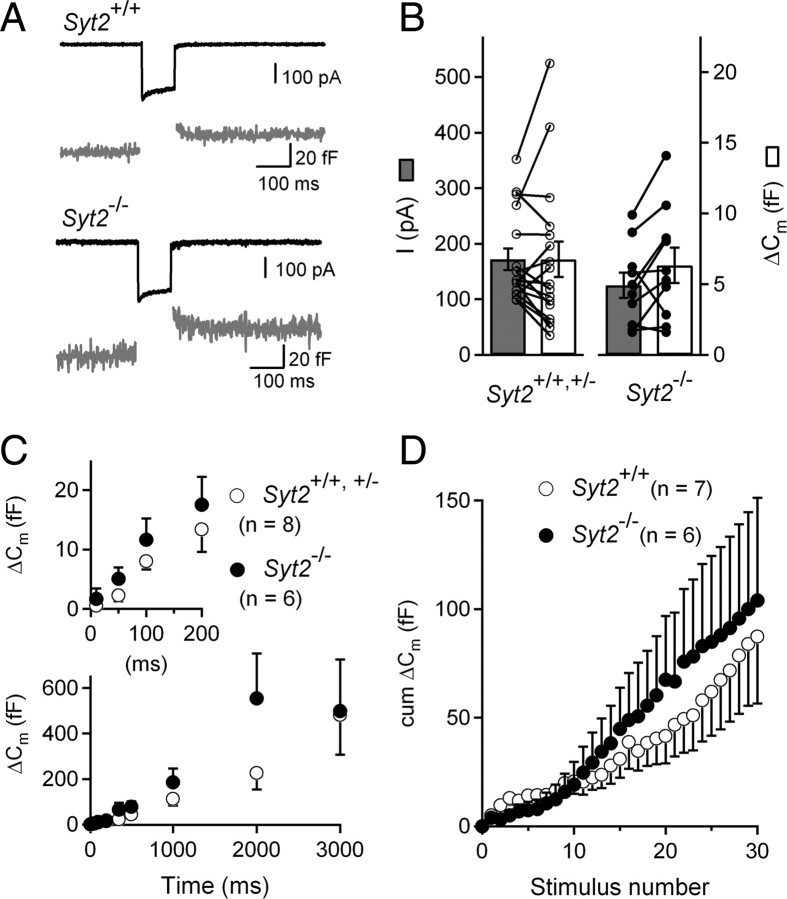
Figure 5.
Ca2+-evoked exocytosis in IHCs from P2–P3 Syt2−/− mice. A, Examples of Ca2+-evoked exocytosis in P2–P3 Syt2+/+ and Syt2−/− IHCs. Cells were stimulated by a 100 ms voltage step to −10 mV from a holding potential of −90 mV. B, Bar graph of average and individual ICa peak amplitudes and their corresponding ΔCm values for Syt2+/+ (n = 17) and Syt2−/− (n = 10) IHCs. C, Kinetics of Ca2+-dependent exocytosis. Only cells with large ΔCm responses were included for the analysis in this graph. D, Average cumulative ΔCm responses from P2–P3 Syt2+/+ and Syt2−/− IHCs elicited using 50 ms repetitive voltage steps to −10 mV (interstep intervals of 100 ms).

