
Figure 6.
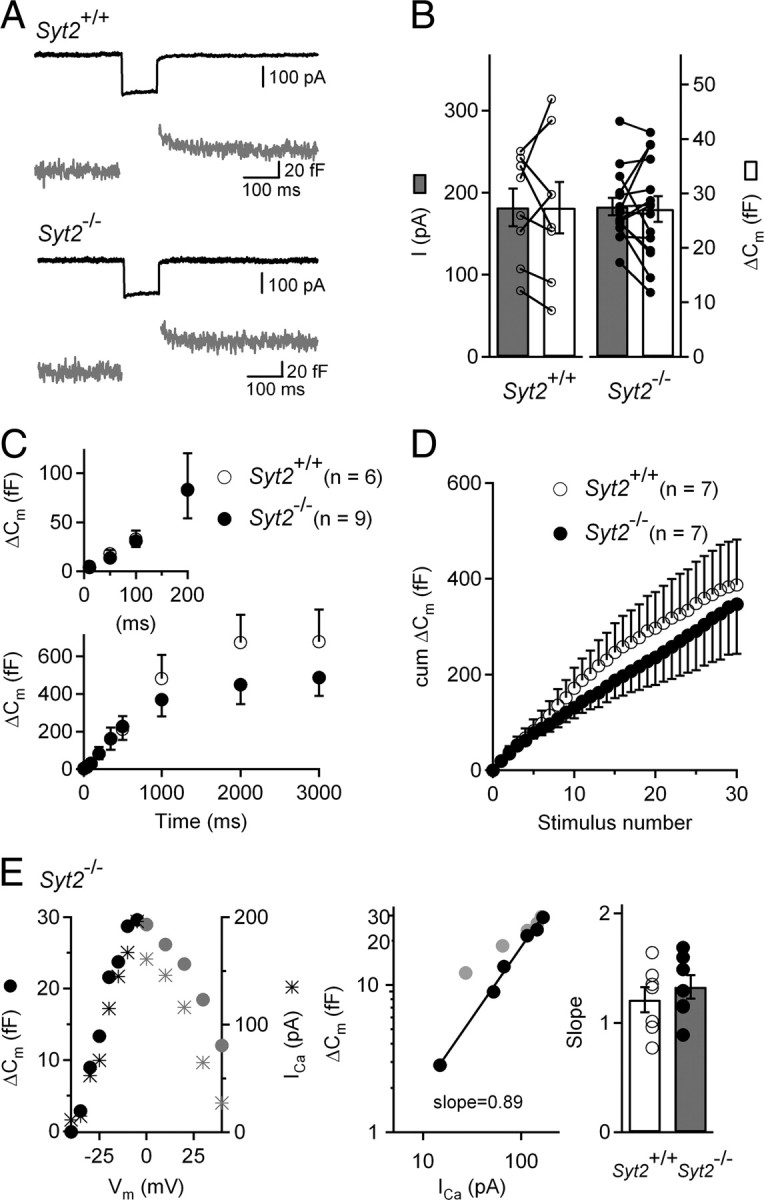
Ca2+-evoked exocytosis in IHCs from P15–P17 Syt2−/− mice. A, Examples of Ca2+-evoked exocytosis in P15–P17 Syt2+/+ and Syt2−/− IHCs. Cells were stimulated by a 100 ms voltage step from a holding potential of −90 to −10 mV. B, Bar graph of average and individual ICa peak amplitudes and their corresponding ΔCm values, for Syt2+/+ (n = 8) and Syt2−/− (n = 15) IHCs. C, Kinetics of Ca2+-dependent exocytosis. ΔCm is plotted against stimulus duration for pulses to −10 mV. Note that the Syt2+/+ and Syt2−/− data points are overlaid in inset. D, Average cumulative ΔCm responses from P15–P17 Syt2+/+ and Syt2−/− IHCs elicited by 50 ms repetitive voltage steps to −10 mV (interstep interval of 100 ms). E, Left, ΔCm and ICa peak amplitude for an IHC from a P16 Syt2−/− mouse, plotted for different voltages following a 100 ms voltage step from a holding potential of −90 mV. Gray points indicate voltages beyond the ICa peak which were not taken into account to calculate the ΔCm-ICa slope. Middle, Corresponding ΔCm versus ICa plot. The logarithmized data were fitted by a line, giving a slope of 0.89. Right, Average and individual slope values for P15–P17 Syt2+/+ (n = 7) and Syt2−/− (n = 6) IHCs.