
FIGURE 3. Inhibition of PQ2+-induced H2O2 production in stimulated mitochondria.
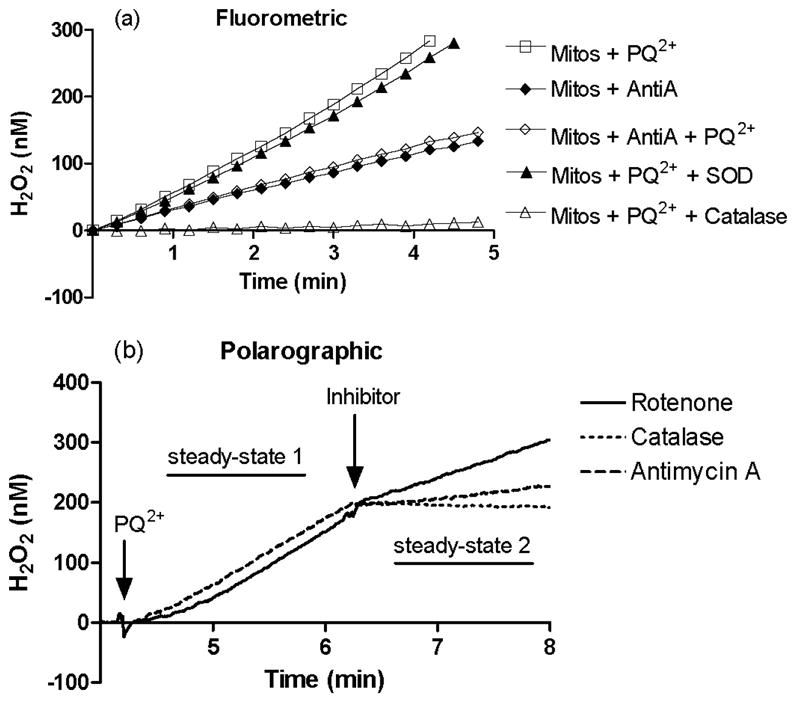
Fluorometric (a) measurement of H2O2 production from isolated mitochondria in the presence of succinate was measured in the presence of PQ2+(250 μM, □), antimycin A (◆), antimycin A and PQ2+(◇), PQ2+ and SOD (▲), and PQ2+and catalase (△). Polarographic (b) measurement was used to confirm results. Following the addition of 250 μM PQ2+, H2O2 production in mitochondria was monitored with inhibitors added as indicated: rote-none (solid line), catalase (dotted line), and antimycin A (dashed line). Rates of H2O2 production before and after the addition of inhibitor (steady state 1 and 2, respectively) were compared with obtain the percentage of H2O2 production under each condition (see Fig. 5).