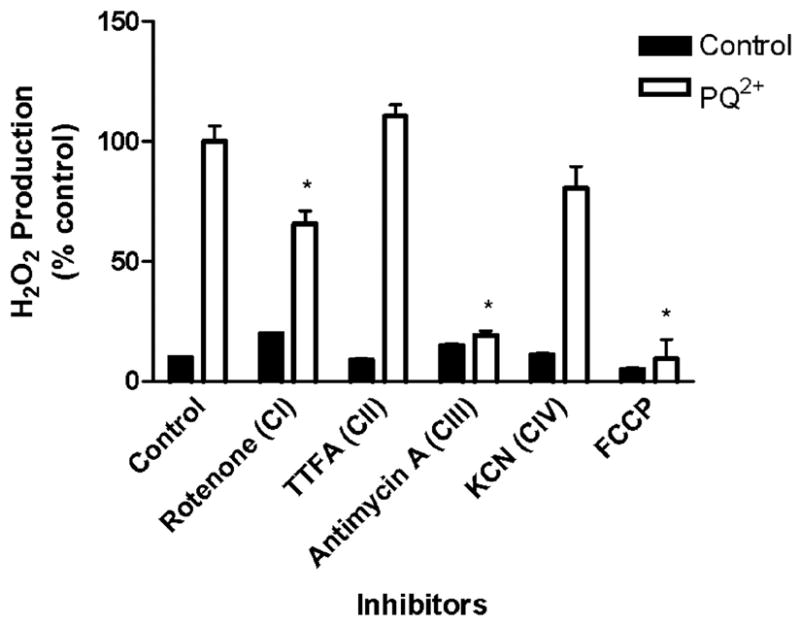
FIGURE 5. Effect of ETC inhibitors on PQ2+-induced H2O2 production in primary midbrain cultures.

H2O2 production was measured in midbrain cultures incubated in buffer containing PQ2+ and inhibitors where indicated using a fluorometric method as described under “Experimental Procedures.” H2O2 production in the presence of PQ2+ was considered 100%, and all values are expressed as a percentage of this (mean ± S.E., n = 3). *, p < 0.05 compared with PQ2+-treated control mitochondria (one-way analysis of variance).
