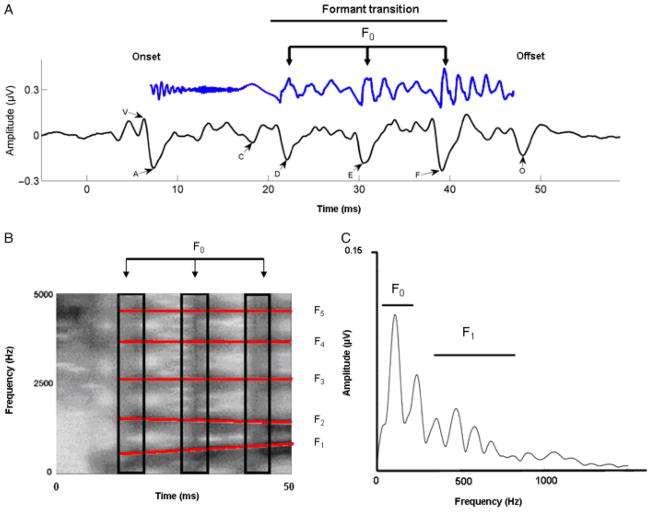
Figure 1.
A: Time-amplitude waveform of a 40-ms synthesized speech stimulus /da/ is shown in blue (time shifted by 6 ms to be comparable with the response). The first 10 ms are characterized by the onset burst of the consonant /d/; the following 30 ms are the formant transition to the vowel /a/. The time-amplitude waveform of the time-locked brainstem response to the 40-ms /da/ is shown below the stimulus, in black. The onset response (V) begins 6–10 ms following the stimulus, reflecting the time delay to the auditory brainstem. The formant transition period is marked by wave C that marks the change from the burst to the periodic portion of the syllable, that is, the vowel. Waves D, E, and F represent the periodic portion of the syllable (frequency-following response) from which the fundamental frequency (F0) of the stimulus can be extracted. Finally, wave O marks stimulus offset. B: Broadband spectrogram of the 40-ms /da/. Darker areas indicate regions of greater energy. For the benefit of the reader, formants 1–5 are marked with red lines. The burst is characterized by a high-frequency energy during the first 10 ms, followed by formant transition into the vowel. Relative spacing between F1 and F2 frequencies relate to vowel identity. The black rectangles highlight the vertical bands in the spectrogram, which reflect glottal pulses. C: Fast Fourier transform analysis of the brainstem response to the stimulus /da/. The spectrum reveals clear representation of the fundamental and its harmonics. Also represented is the time-varying F1 (as an increase in the amplitude of the peaks encompassing the F1 range).

