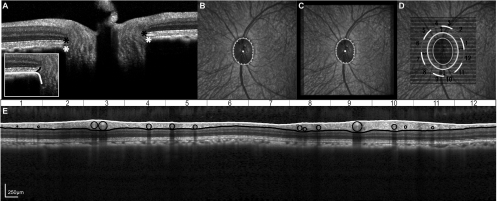
Figure 4.
(A) The border tissue and RPEBruch's membrane were marked (black and white asterisks) on radial scans. (B) The corresponding NCO points on the IR-SLO image were plotted and fit with an ellipse. (C) The ONH best fit ellipse was registered to the raster scan SLO (D) Scans 300 to 600 μm from the ONH rim edge were interpolated from radial scans. (E) B-scans were analyzed using the same algorithm as that for standard scans.

