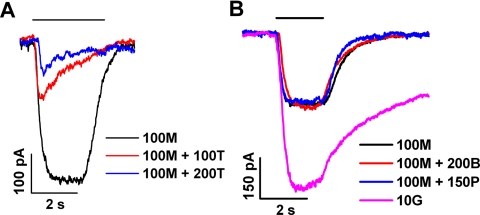
Figure 2.
Test of propofol activity on responses to 5Me-I4AA. 5Me-I4AA, TPMPA, bicuculline, and propofol are abbreviated in the figure as M, T, B, and P, respectively. (A) Responses obtained from a single cell on the application of 100 μM 5Me-I4AA alone (black trace) and of 100 μM 5Me-I4AA with co-applied 100 or 200 μM TPMPA (red and blue traces, respectively). (B) Responses obtained from a second cell to 100 μM 5Me-I4AA alone (black), 100 μM 5Me-I4AA plus 200 μM bicuculline (red), 100 μM 5Me-I4AA plus 150 μM propofol (blue), and 10 μM GABA alone (purple).

